Data exploration and semi-automated quality control#
Exploring your data properly is an important step for deciding which cells to include to your atlas. Based on insights gathered from analysing the data pre integration, you can determine the quality of each input dataset, as well as the data completeness of metadata and features. If the quality of a dataset is not sufficient for the atlas you are planning to build, you might want to consider excluding that dataset from the study. This also applies to cases where metadata is missing and/or not obtainable, or whenever important genes are missing from the datasets.
Install dependencies#
For this workflow, make sure you install the following environments:
envs/scanpy.yamlenvs/qc.yamlforqcmoduleenvs/doublets.yamlfordoubletsmodule
Configuring a basic QC workflow#
Cell-level quality control can tell you about the quality of the data due to experimental conditions.
Even for published studies, where you would usually obtain already filtered data, you would want to investigate the QC thresholds that the authors have chosen.
In the following is an example on test data for setting up a first iteration of QC plots.
Start creating a config file called configs/qc/qc_config.yaml (see example under configs):
output_dir: data/out
images: images
user_gpu: false

DATASETS:

  example_qc_analysis:
    input:
      qc:
        test1: data/pbmc68k.h5ad # adjust to custom file path
        test2: data/pbmc68k.h5ad # adjust to custom file path
      merge: qc
    qc:
      counts: X  # raw counts slot
      hue: # obs columns you want in your plot
        - bulk_labels
        - batch
        - phase
Call the pipeline with either your runner script (e. g. called configs/qc/run.sh)
bash configs/qc/run.sh qc_all -nq
You should get the following dry-run output:
Config file configs/outputs.yaml is extended by additional config specified via the command line.
Config file configs/load_data/config.yaml is extended by additional config specified via the command line.
Config file configs/exploration/config.yaml is extended by additional config specified via the command line.
WARNING: Duplicated columns: {'metric': ['methods', 'metrics']}
Building DAG of jobs...
Job stats:
job                    count
-------------------  -------
qc_all                     1
qc_autoqc                  2
qc_get_thresholds          2
qc_merge_thresholds        1
qc_plot_joint              2
qc_plot_removed            2
total
Execute the QC workflow as follows:
bash configs/qc/run.sh qc_all -c2
This will estimate QC thresholds using the sctk’s scAutoQC function.
Output#
Check the outputs under images/qc.
$ ls -l images/qc/dataset\~example_qc_analysis/

total 16
drwxr-xr-x@ 6 michaela.mueller  2125895594  192 Jun 30 16:07 file_id~test1
drwxr-xr-x@ 6 michaela.mueller  2125895594  192 Jun 30 16:08 file_id~test2
-rw-r--r--@ 1 michaela.mueller  2125895594   60 Jun 30 16:06 qc_stats.tsv
-rw-r--r--@ 1 michaela.mueller  2125895594  829 Jun 30 16:06 thresholds.tsv
There are per dataset and per file outputs.
The thresholds.tsv contains the estimated thresholds for both input files test1 and test2, while qc_stats.tsv contains the overall statistics of cells that passed or failed the QC thresholds.
file_id	passed	failed	ambiguous
test1	0	700	0
test2	0	700	0
dataset	file_id	threshold_type	passed_frac	removed_frac	n_passed	n_removed	n_total	percent_mito_min	percent_mito_max	n_genes_min	n_genes_max	n_counts_min	n_counts_max
example_qc_analysis	test1	sctk_autoqc	0.0	1.0	0	700	700	0.0	0.08410688	201.73354	764.9998	1948.412	2086.3728
example_qc_analysis	test1	user	0.0	1.0	0	700	700
example_qc_analysis	test1	alternative	0.0	1.0	0	700	700
example_qc_analysis	test1	updated	0.0	1.0	0	700	700	0.0	0.08410688	201.73354	764.9998	1948.412	2086.3728
example_qc_analysis	test2	sctk_autoqc	0.0	1.0	0	700	700	0.0	0.08410688	201.73354	764.9998	1948.412	2086.3728
example_qc_analysis	test2	user	0.0	1.0	0	700	700
example_qc_analysis	test2	alternative	0.0	1.0	0	700	700
example_qc_analysis	test2	updated	0.0	1.0	0	700	700	0.0	0.08410688	201.73354	764.9998	1948.412	2086.3728
There are also separate outputs per original input file, which contains per file_id threshold files as well as joint_plots and removed directories.
Joint plots#
$ ls -l images/qc/dataset~example_qc_analysis/file_id~test1/

total 16
drwxr-xr-x@ 3 michaela.mueller  2125895594   96 Jun 30 16:08 joint_plots
-rw-r--r--@ 1 michaela.mueller  2125895594   46 Jun 30 16:06 qc_stats.tsv
drwxr-xr-x@ 5 michaela.mueller  2125895594  160 Jun 30 16:07 removed
-rw-r--r--@ 1 michaela.mueller  2125895594  498 Jun 30 16:06 thresholds.tsv
$ ls -l images/qc/dataset\~example_qc_analysis/file_id\~test1/joint_plots

total 0
drwxr-xr-x@ 6 michaela.mueller  2125895594  192 Jun 30 16:22 hue=batch
drwxr-xr-x@ 6 michaela.mueller  2125895594  192 Jun 30 16:22 hue=bulk_labels
drwxr-xr-x@ 6 michaela.mueller  2125895594  192 Jun 30 16:22 hue=percent_mito
drwxr-xr-x@ 6 michaela.mueller  2125895594  192 Jun 30 16:22 hue=phase
drwxr-xr-x@ 6 michaela.mueller  2125895594  192 Jun 30 16:22 hue=qc_status
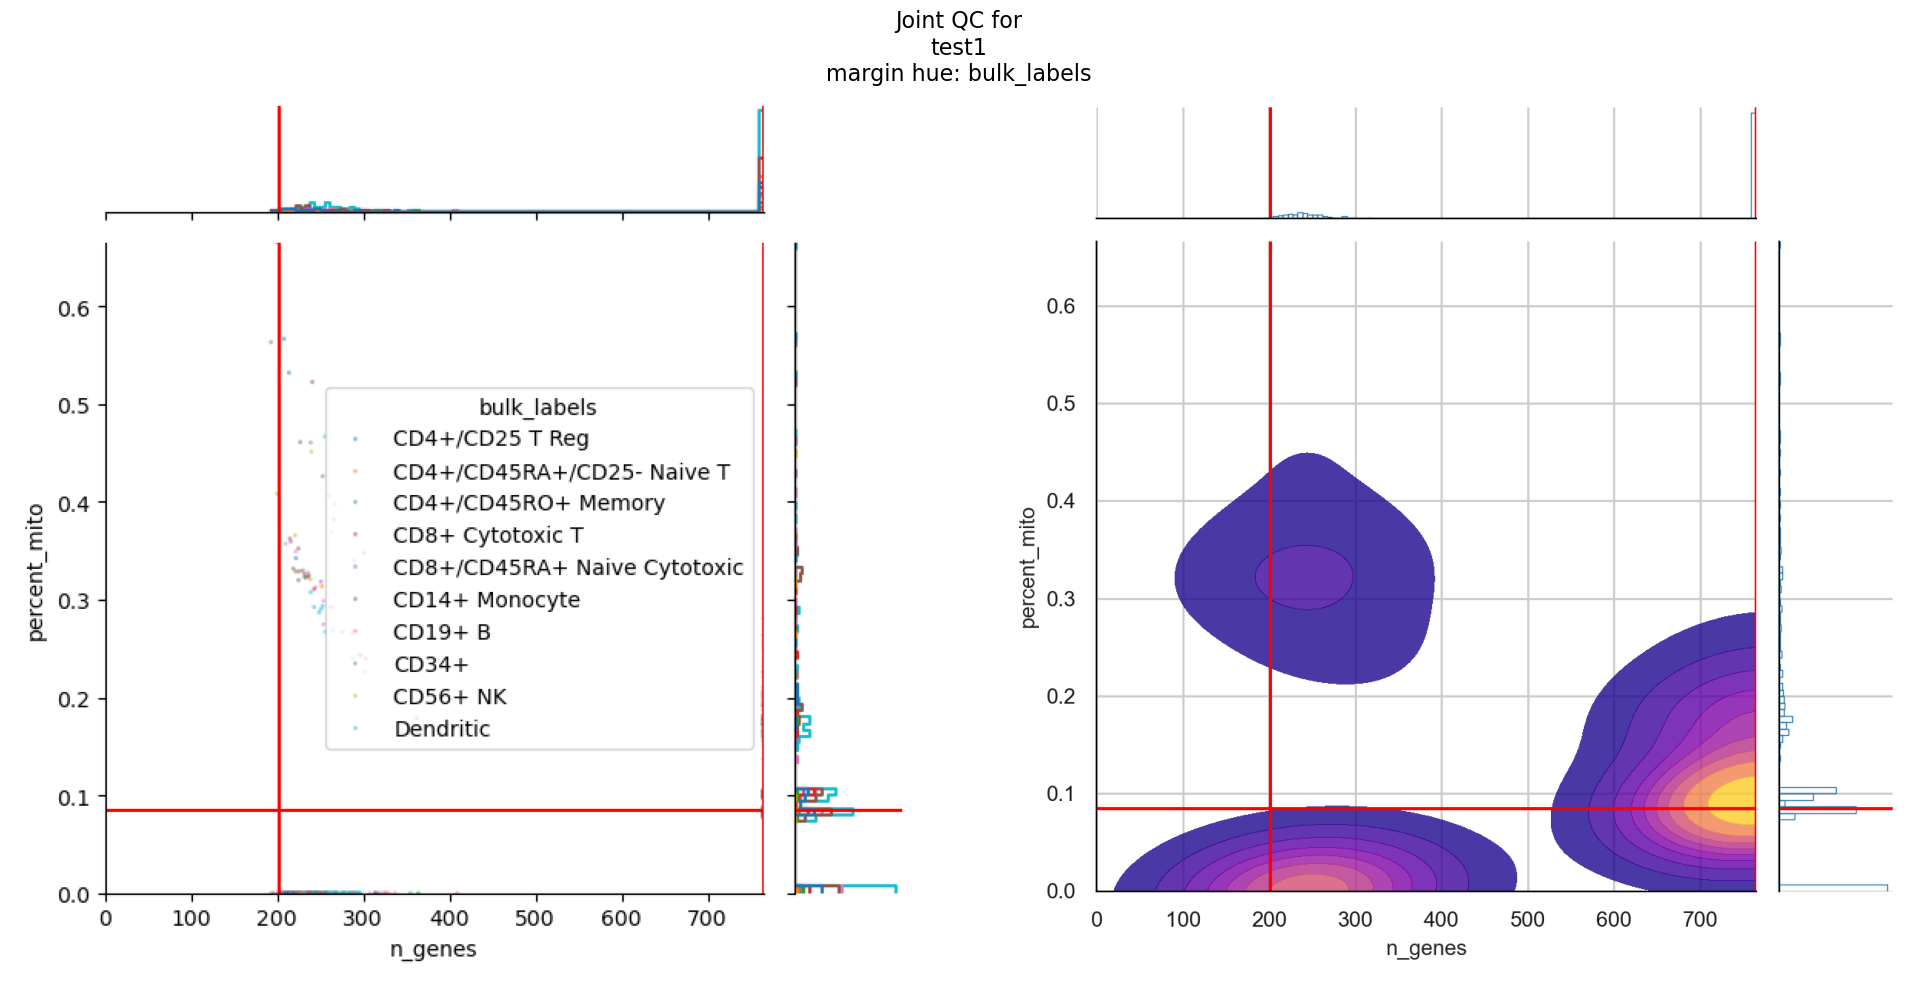
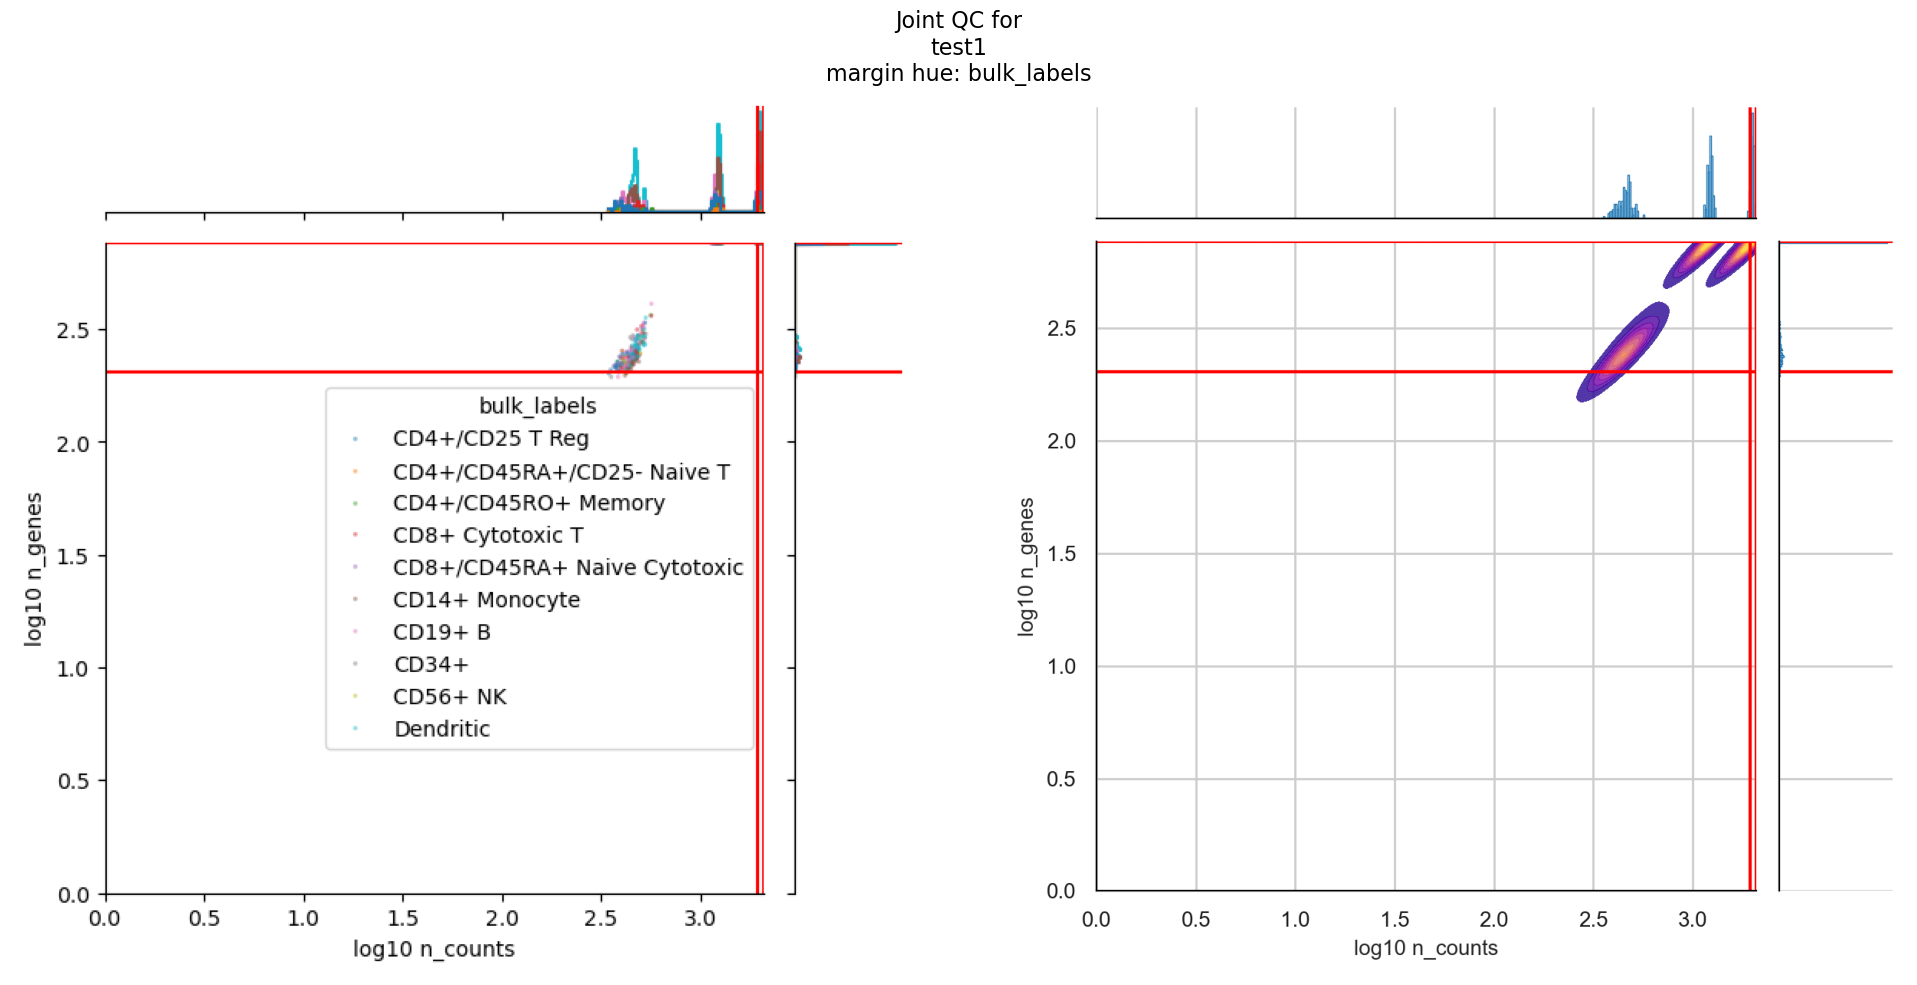
Each of the plot outputs contains all the hues that you have defined in the config.
For joint_plots, additional hues have been added for mitochondrial percent and qc status, as inferred by the QC metric computation stage.
For each hue, there are different joint plots that combine either the number of UMI counts per cell against number of expressed genes or the number of expressed genes against mitochondrial percentage.
TL;DR Full Configuration#
You can find the complete configuration file and runner script under configs/qc/.
Here’s the final workflow configuration:
output_dir: data/out
images: images
user_gpu: false

DATASETS:

  example_qc_analysis:
    input:
      qc:
        test1: data/pbmc68k.h5ad # adjust to custom file path
        test2: data/pbmc68k.h5ad
      merge: qc
    qc:
      counts: X  # raw counts slot
      hue: # obs columns you want in your plot
        - bulk_labels
        - batch
        - phase
#!/usr/bin/env bash
set -e -x

snakemake \
  --profile .profiles/local \
  --configfile \
    configs/qc/qc_config.yaml \
  --snakefile workflow/Snakefile \
  --use-conda \
  --rerun-incomplete \
  --keep-going \
  --printshellcmds \
    $@